Read the right signals before they turn into lasting drifts
A good energy dashboard is used to spot consumption, availability, or incident drifts early enough to trigger useful action.
Energy dashboards to track consumption, incidents, availability, and operational performance. The need appears when operations or maintenance decisions lack consolidated visibility.
A good energy dashboard is used to spot consumption, availability, or incident drifts early enough to trigger useful action.
The real value comes from the link between indicator, event, and affected asset, not from a visualization separated from field operations and maintenance.
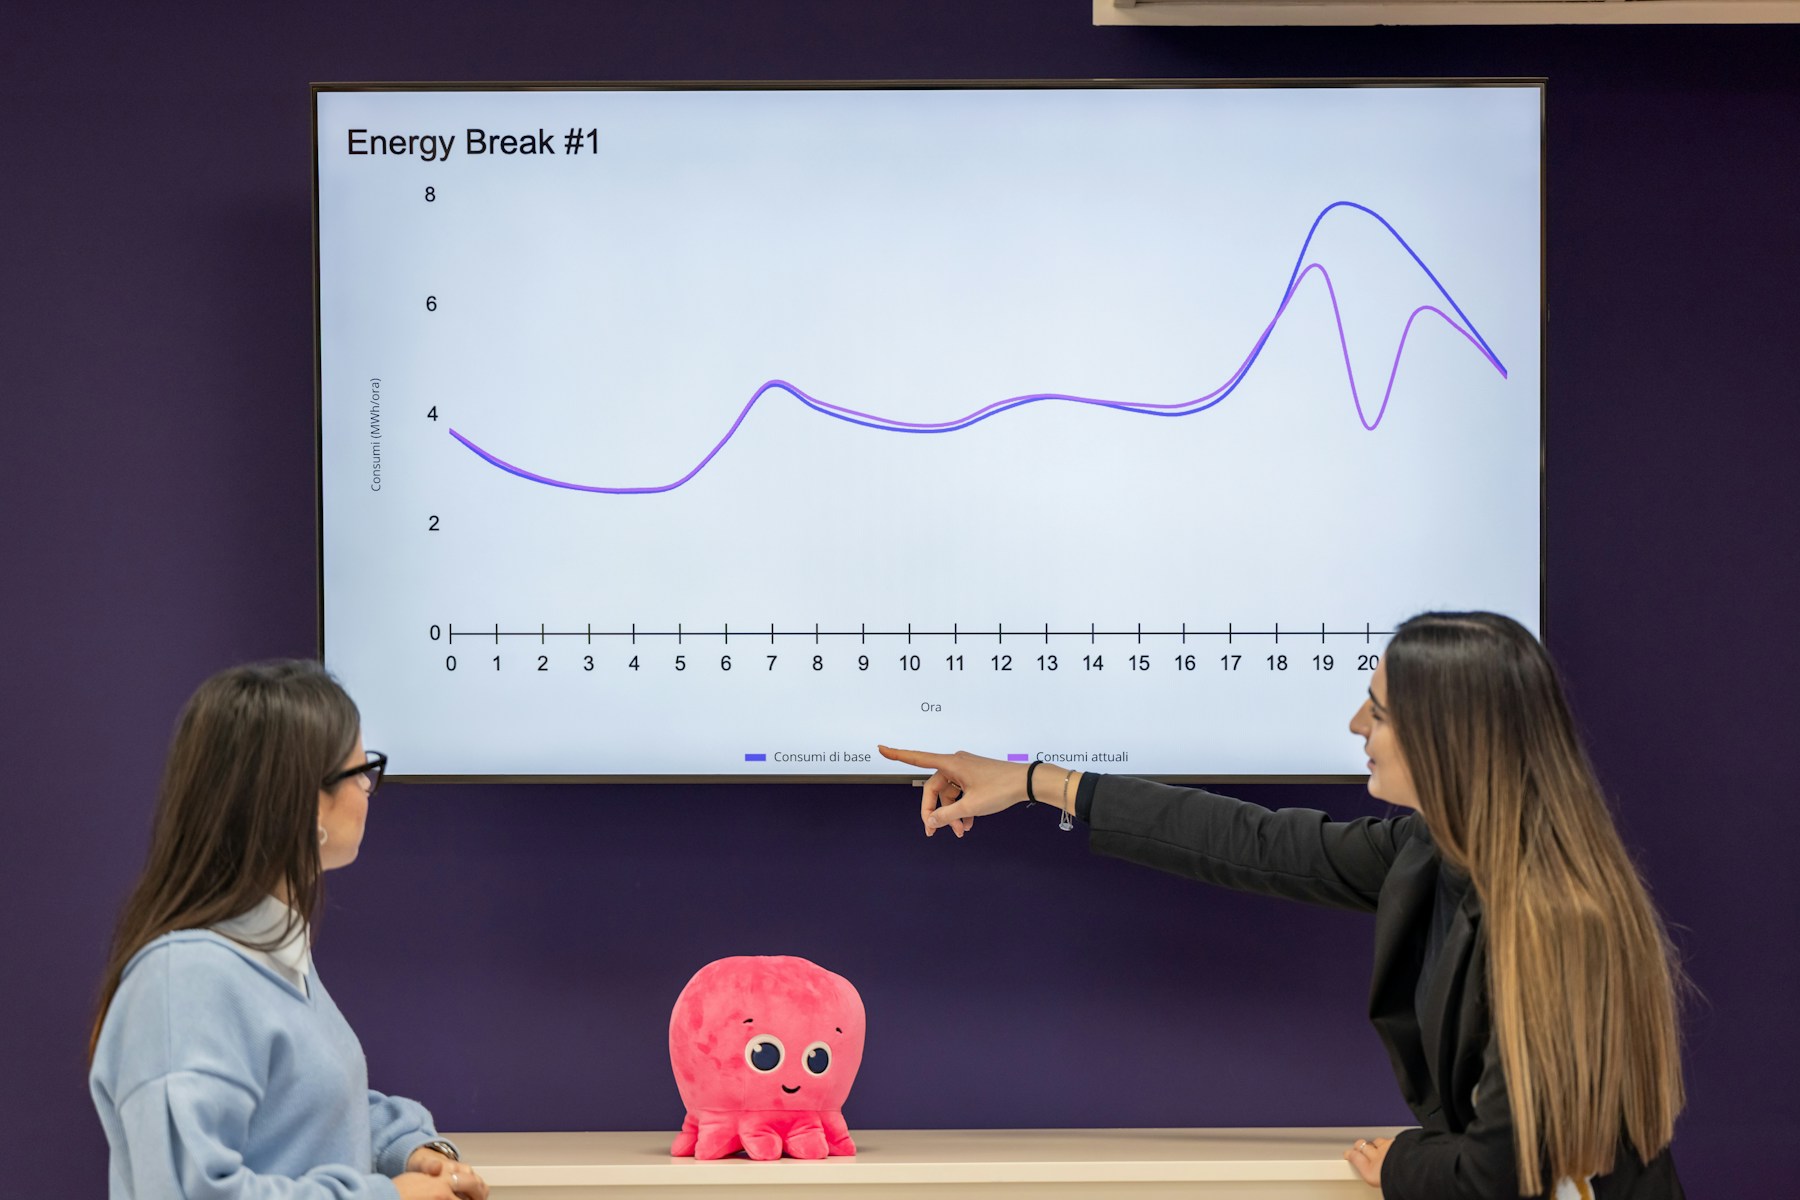
Leadership, operations, and maintenance must compare the same data while keeping the ability to drill back down to local causes.
The need appears when operations or maintenance decisions lack consolidated visibility. Dashboards can bring together energy KPIs, supervision, filters, alerts, multi-site comparisons, and availability views in one shared view. They can also connect an indicator to an incident, an intervention, or a consumption drift to accelerate trade-offs.
Make consumption, incidents, availability, load, and drifts readable on the assets or sites that truly matter. Detect anomalies faster and give operations, maintenance, and leadership the same shared view. Faster energy steering, less dependence on manual consolidations, and a simpler explanation path between operations, maintenance, and leadership.
KPIs must remain sourced, traced, documented, and visible to the right roles to support credible technical decisions. Faster energy steering, less dependence on manual consolidations, and a simpler explanation path between operations, maintenance, and leadership.
It is used to make an operations, maintenance, or trade-off decision faster on an asset or a site. If it does not help teams see a drift in consumption, availability, or incidents earlier, it remains mere reporting rather than a steering tool.
Energy dashboards to track consumption, incidents, availability, and operational performance.
Supervise energy infrastructure with alerts, statuses, incidents, and a consolidated operations view.
Software to manage field interventions, teams, statuses, evidence, and time to restore service.
Structure energy maintenance with preventive and corrective work, planning, parts, and asset tracking.
To connect existing tools, data, and critical workflows.
Internal tools, business CRMs, portals, and operating platforms to replace files, clarify roles, and improve control.
We can discuss your needs free of charge and explain clearly how we can help, with no obligation.